It’s that time of year: Transparency Report publication!
While this summer does not feel like summers past, which were perhaps full of carefree beach reads and a break from the busy holiday production schedules, we maintain our core focus of collecting and publishing the data which turned the gears on our 2019 imports and sales. We get excited in the summertime, which is usually a slow time for chocolate, since we are able to amp up the volume on the transparency work we do which lies behind every transaction in our supply chain, and every bag of cacao you use.
We at Uncommon Cacao fundamentally believe that radical transparency is the key to creating a more ethical, sustainable chocolate supply chain for all actors involved. The interdependence in all supply chains shows us just how vulnerable we are to the failure of one link in the chain, and we are committed to protecting our chocolate supply chain against that risk.
By publishing comprehensive and detailed information about where our cacao comes from, who produces it, how much is paid at all levels of the supply chain, as well as social and environmental impact data related to these purchases, we are able to open up an industry-wide conversation about realities for all actors producing and selling specialty cacao. This, we believe, leads to mutual respect and better business practices.
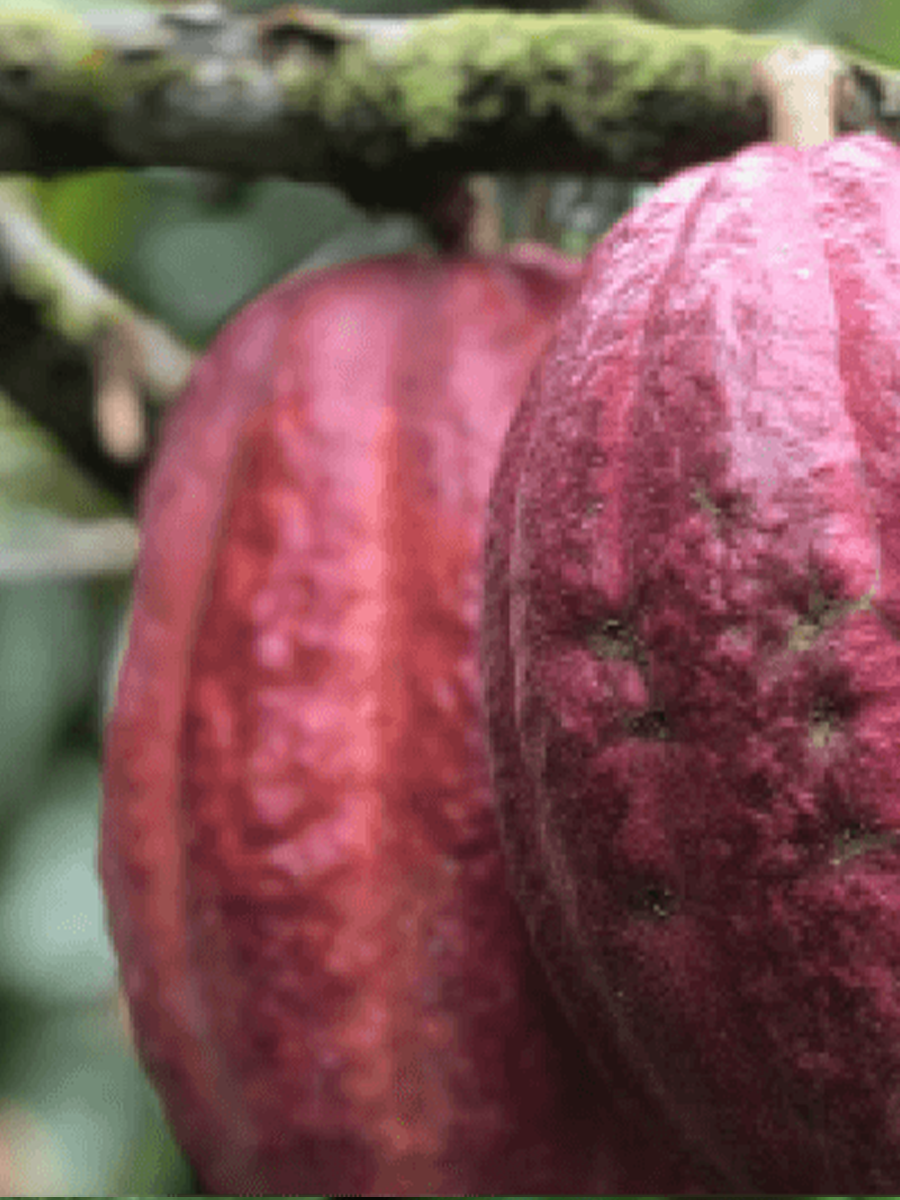
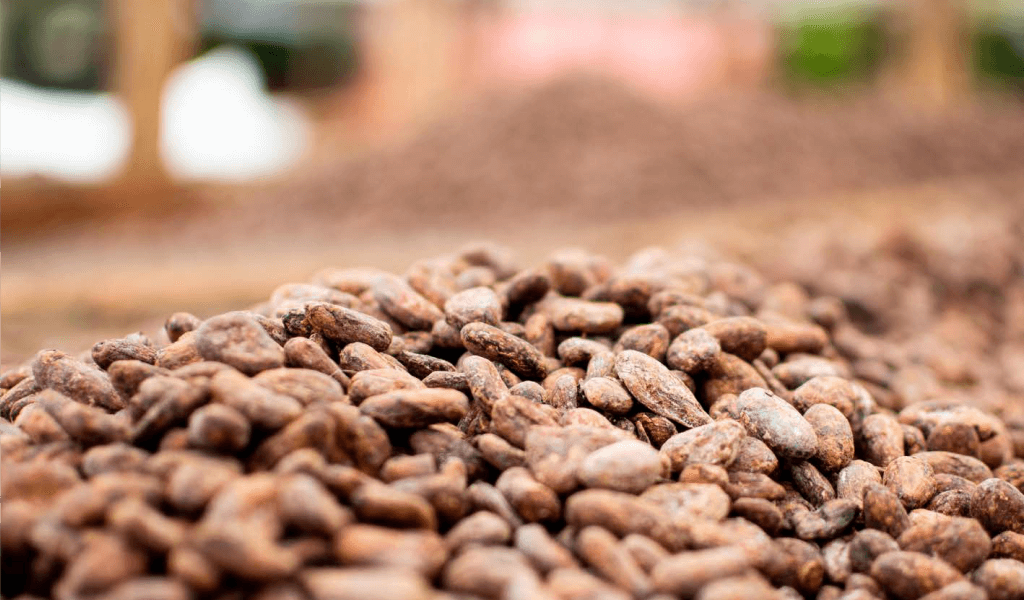
Our Transparency Report is the first, and key, lever in facilitating this interconnectedness. Every year since 2012, Uncommon Cacao has published these reports showing pricing data for our supply chain and sharing stories and information about the incredible producers from whom we source our beans. We were the first cacao export company to publish a report of this kind, and to date we are still the only cacao broker to publish farmgate-to-factory pricing. You can find the 2019 data on each origin page.
What’s different this year
Historically, we’ve produced a PDF that can easily be printed and put in storefronts, or embedded into a website. It typically has additional information beyond the numbers and metrics; farmer interviews, origin stories, updated photos. This year, we focused our efforts into a third party audit of the back-end spreadsheet that typically informs these PDFs. While we are also planning to produce a PDF, it will be simpler and focused on the numbers. In the meantime, we are also planning a webinar open to all of our customers for the purpose of reviewing our data collection and analysis process so we can answer any questions you might have about this year’s data.
Why?
Integrity of data is key. Each year, our team internally does our best to crunch and verify numbers provided by our partners. However, since they are ‘our’ partners, we recognize that there could be a perceived conflict of interest. We intend to move forward each year from now on with 3rd party audited data, especially for those customers that require certifications for certain market access.
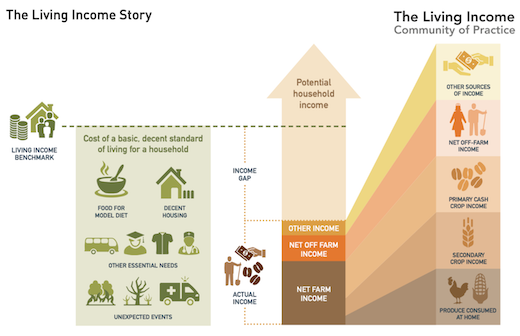
Challenging our own assumptions, through explaining rationale to a 3rd party, helps us clarify the meaning of the data, and what we hope it can illuminate and potentially change. For example, we usually change all farmgate pricing to “dry kg equivalent” to make it easily comparable to Ghana and Ivory Coast, as well as the international export price. However, given that all processors / exporters have different retention rates for wet:dry ratios, we have found that this makes certain farmgate prices look higher or lower after the calculation of retention, which isn’t 100% accurate in terms of farmer income.
Efficiency in a COVID world is paramount. Our team generally wears a lot of hats, and with the COVID crisis, we adopted even more. We wanted to focus on our partners, offering support up and down the supply chain, rather than asking our supply partners for photos, farmer interviews, etc. and taking away from their capacities to buckle down and survive the health crisis.
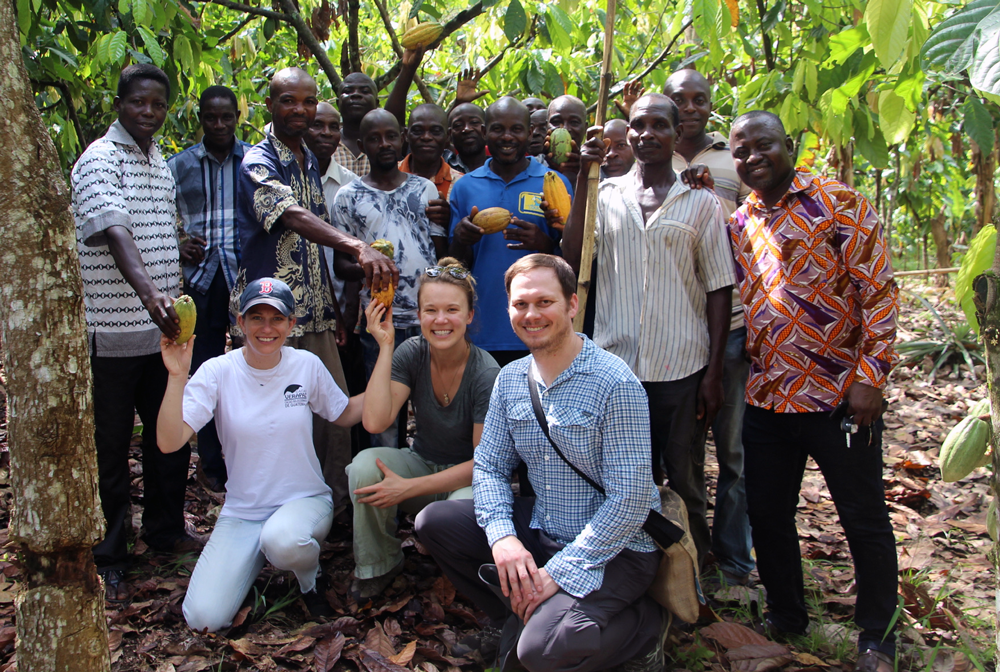
We partnered with the Association for Socially Responsible Business at UC Berkeley to run a full audit of our data, so we could accomplish the above goals. This group of undergraduate students took a look at all the data provided by each origin partner, compared that reported data to images of receipts and lot tracking records, our contracts, and our sales reports, to compile a fully audited data set.
Key metrics
1738 registered women farmers in our network; this is a 32% increase since 2018 and represents 32% of the total registered farmers in our network
We purchase 288 MT from our supply partners in 2019, a 49% increase over 2018
We saw a 3% increase in average farmgate price paid by our supply partners to farmers, from $2.44 to $2.51 per dry Kg equivalent
-
Average price paid by UC to our supply partners (exporters) was 111% higher than the average commodity (NY ICE) price in 2019
-
Weighted average FOB was $5.01
Fair trade floor is $2.40 // fair trade avg would have been $2.54, meaning our weighted average FOB paid across our supplier network was 2x the fair trade floor price
-
5,971 organic hectares in network